Other tools
Excel and Power BI are two software tools developed by Microsoft which are very useful for data management, analysis and visualization. Here is a brief introduction for each of them:
Proxima has supported many companies in the optimization and best practices for using these tools.
Microsoft Excel :
In our early phases of project conceptualization and mapping, we often use Microsoft Excel. This tool, known for its flexibility and ease of use, allows us to quickly compile our collective ideas and structure the initial project data. We use Excel to produce detailed drafts that facilitate communication and encourage collaboration within the team. In addition, it provides an easy gateway to more specialized software, ensuring a smooth and efficient project start-up.
In short, Microsoft Excel is a powerful spreadsheet program that allows you to create, organize and manipulate spreadsheets containing data in the form of rows and columns. It offers many features for performing calculations, data analysis and creating graphs.
Common uses:
- Track expenses and income
- Budget creation and financial dashboards
- Inventory management
- Sales and performance analysis
Benefits :
- Familiar interface widely used in the professional world.
- Flexibility to perform a wide variety of data-related tasks.
- Restrictions:
- Can become slow with large amounts of data.
- Advanced visualizations may be limited.
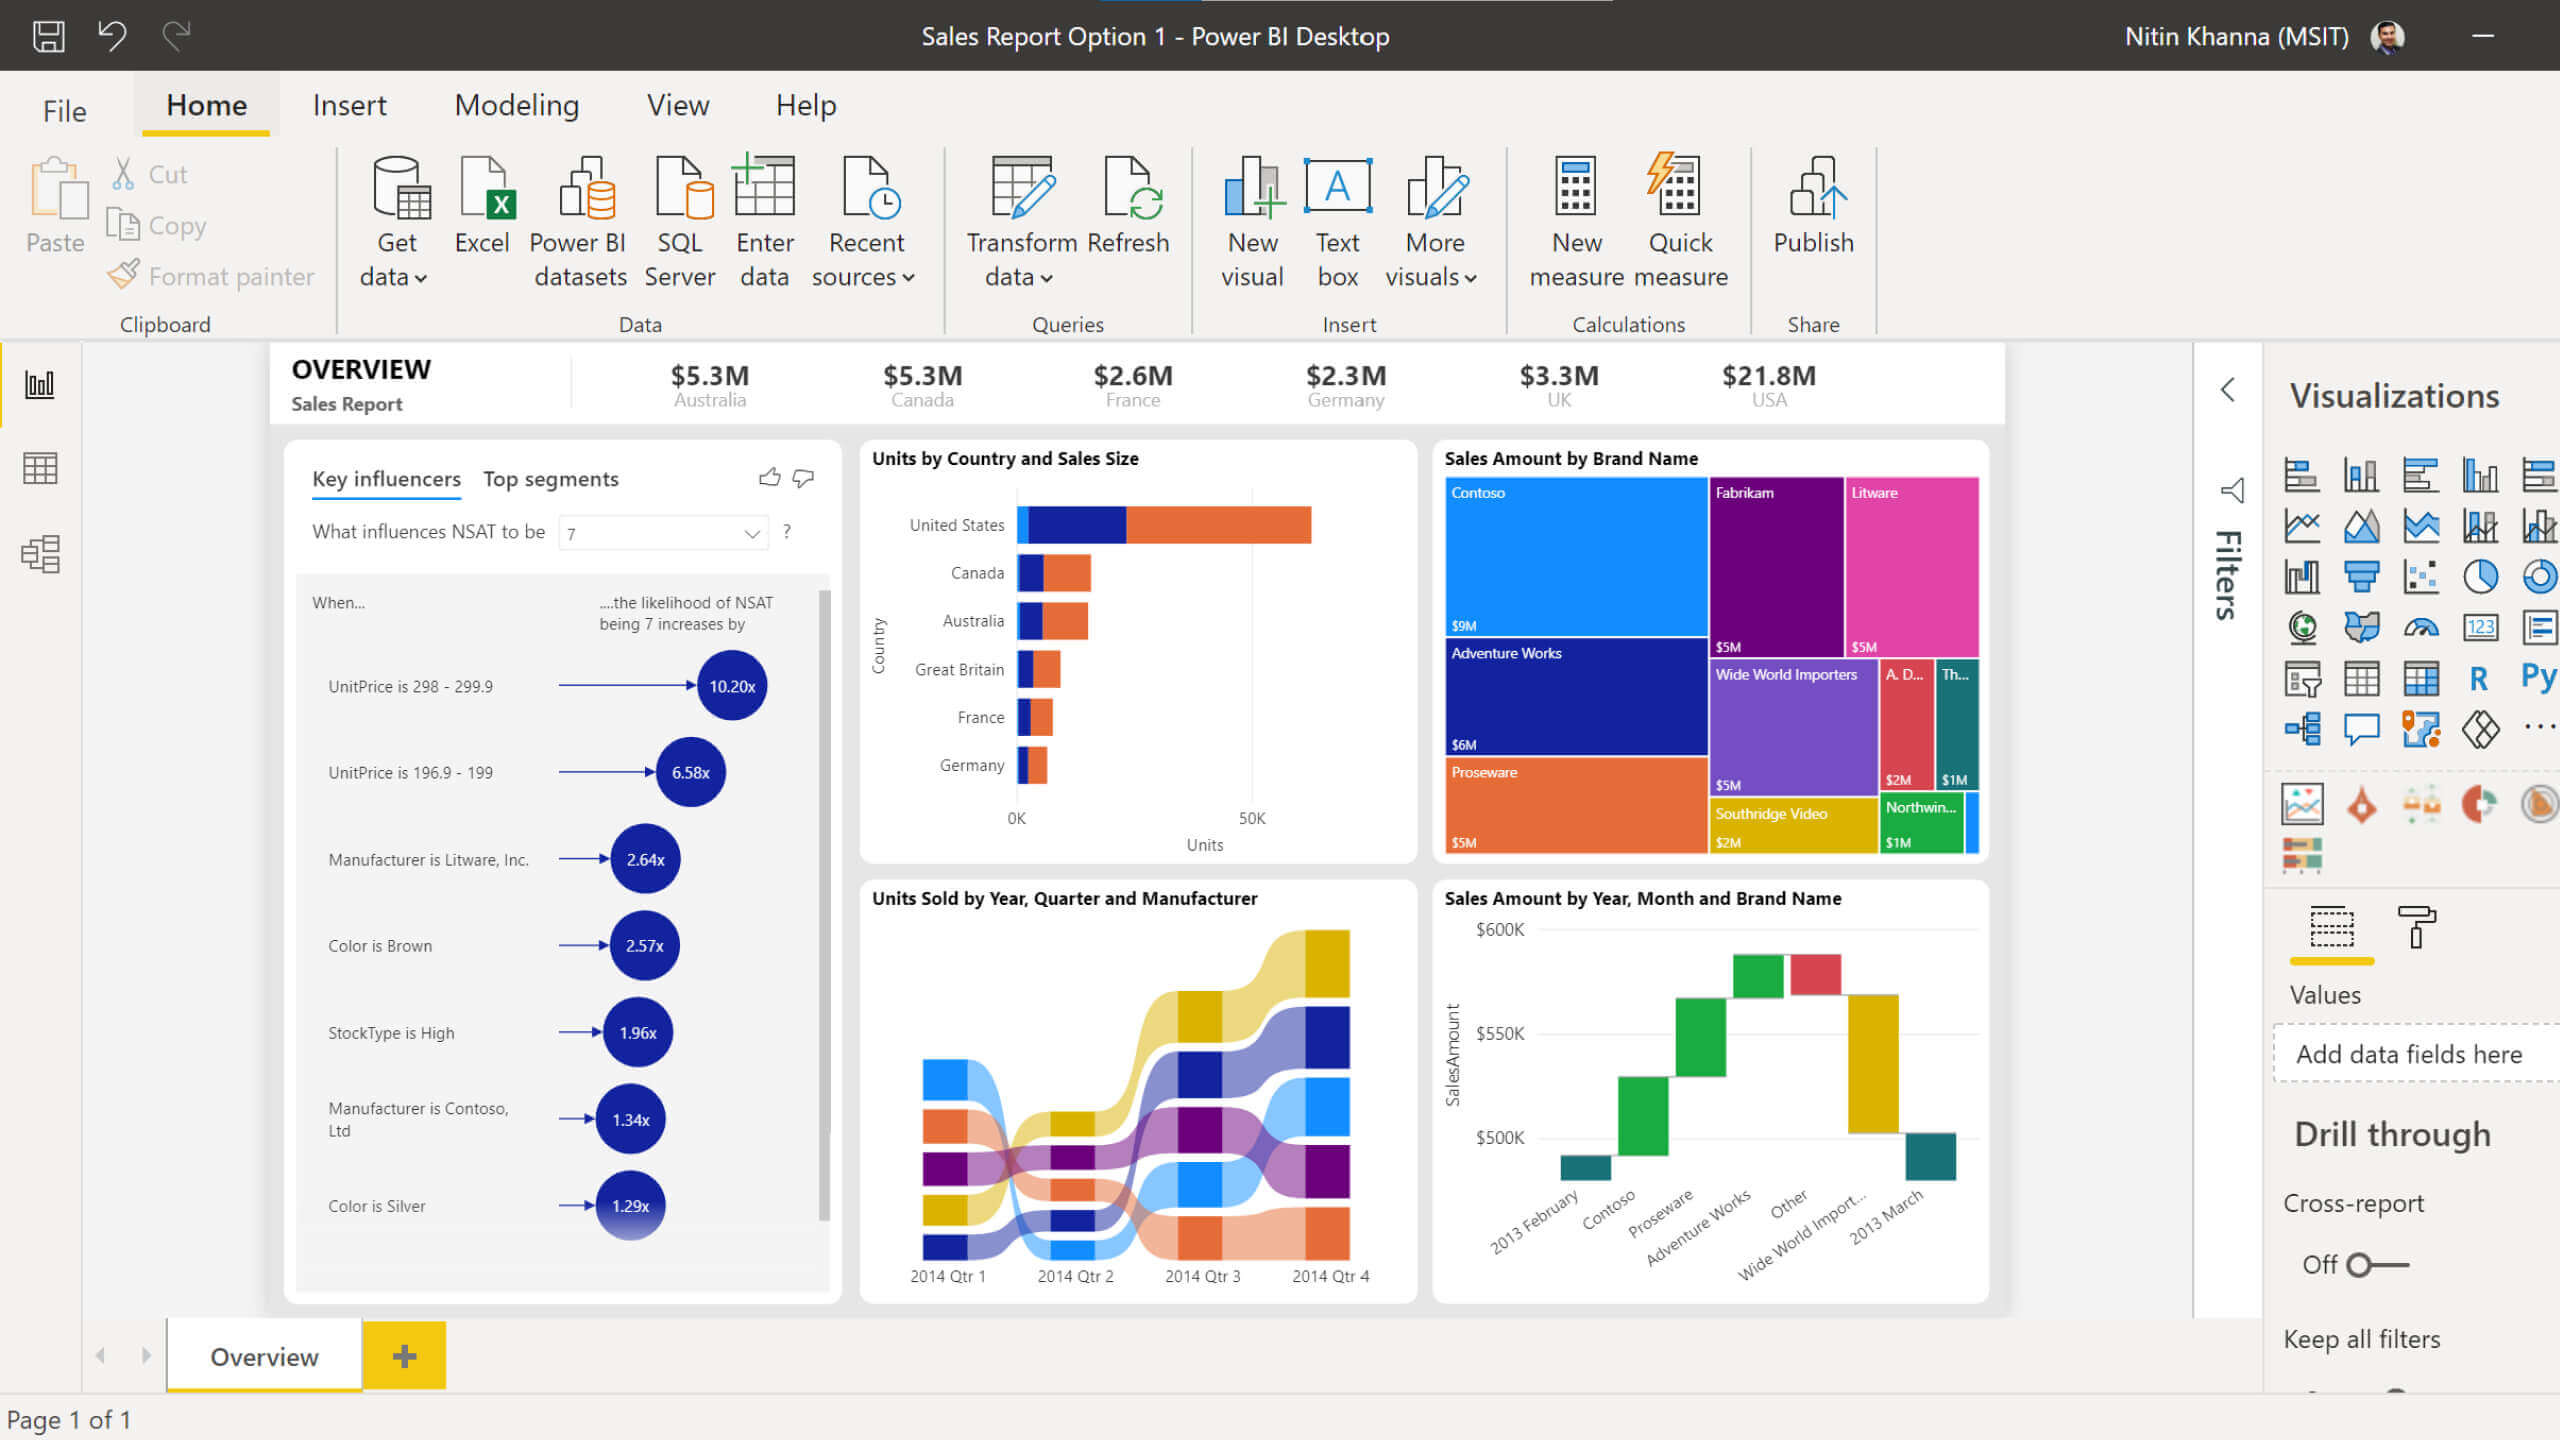
Power Bi (Business Intelligence) :
At Proxima, innovation never stops when it comes to finding the most effective ways to visualize and share information. Although PowerPoint has been our main ally for creating static presentations in the past, today we prefer Microsoft PowerBi, a significant evolution in data representation and sharing.
Using the power of the cloud, we integrate data from a variety of sources with PowerBi, creating dynamic and interactive visualizations that bring our projects to life. Not only does this tool excel over PowerPoint in providing real-time previews and customizable dashboards, but it also makes it easier to securely share dashboard visualization links across our team. This encourages closer collaboration and a deeper understanding of the project’s nuances.
PowerBi also offers easy integration with other Microsoft tools, including PowerPoint, allowing seamless merging of functionality from these platforms as needed. By adopting PowerBi, we do not limit ourselves to the presentation of data; we pave the way for an immersive experience, providing precise insights and powerful analytics that guide our team towards informed decisions based on reliable and current information.
In short, Power BI is a suite of data analysis and visualization tools that allows users to create interactive reports and dynamic dashboards. It connects to various data sources and offers advanced modeling and analysis features. Users can make the most of their data, from initial collection to advanced analysis and visual presentation.
Common uses:
- Creation of interactive reports and dashboards.
- Data consolidation from multiple sources.
- Analysis of trends and commercial performance.
- Information sharing with teams or stakeholders.
Benefits :
- Powerful visualization and analysis capabilities.
- Easy integration with other Microsoft products and cloud services.
Restrictions:
- May require a certain learning curve to take full advantage of its advanced features. Proxima is here to help!
- The full version of Power BI requires a license.